Page 27 - Surveyor 50.2 2015
P. 27

Employability Skills Among Quantity Surveying Graduates in the Construction Industry
                                                                                                                                                                                                   Vol.50 No.2 2015

3. Research                                                          As for Section A, the questions had been                                                                               Online questionnaire is applied for this
Methodology                                                          self-developed whereas Section B and                                                                                   research because the researcher has
                                                                     Section C has been modified based on                                                                                    greater flexibility in displaying questions.
3.1 Questionnaire Design                                             SCANS Model (2001), Mohd Yusof Husain,                                                                                 Besides, the period spent on the analysis
                                                                     Seri Bunian Mokhtar, Abdul Aziz Ahmad,                                                                                 is subsequently reduced since the data is
The purpose of this section is to explain                            Ramlee Mustapha (2010).                                                                                                collected into a central database. It is also
the function of each segment of the                                                                                                                                                         easier to correct the errors on an online
questionnaire. All questions were closed-                            A 5-point-Likert scale ranging from 1 (not                                                                             questionnaire, since the researcher does
ended type and the questionnaire was                                 very important) to 5 (very important) was                                                                              not have to reprint all the questionnaires to
divided into three main sections:                                    used in this study.                                                                                                    distribute to the respondents.

Section A : Background of Employers                                  3.2 Data Collection Technique                                                                                          3.3 Sampling Design

Section B : The importance of employability                          For this study, the researcher used a                                                                                  In this study, the researcher used a
skills through employers perspective                                 quantitative approach to achieve the                                                                                   probability sample to collect data,
                                                                     objectives. The online survey approach is                                                                              which was collected by emailing the
Section C : The elements of employability                            used by sending out email questionnaires                                                                               questionnaires among the employers in
skills needs by employers for Quantity                               to gather information from the                                                                                         Quantity Surveying consultant firms in
Surveying graduates                                                  respondents.                                                                                                           the Malaysian construction industry. A
                                                                                                                                                                                            total number of 241 firms were selected
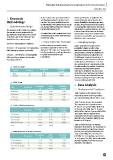
Table 1: Gender                                                                                                                                                                             randomly from 339 QS firms. The data
                                                                                                                                                                                            was conducted over a two month period
Gender                                           Frequency           Percentage                                                          Cumulative                                         to solicit results, from which 33 numbers
GGeennddeerr                                     FFrreeqquueennccyy  PPeerr6cc3%%%ee.6nn0ttaaggee                                        CCuuPPPmmeee6uu3rrrcccll.aa6eee0ttnnniivvtttee     responded. It involved only random
                                                                                                                                                                                            selection for employers because some
Male                                                    21               663363..66400                                                       1660330...660000                               of the firms have more than one branch.
FMMeaamlleeale                                          122211           3366..4400                                                          110000..0000                                   The list of firms were obtained from the
FFeemmaallee                                            1122                                                                                                                                details provided by the Board of Quantity
                                                                                                                                            Cumulative                                      Surveyors Malaysia (BQSM).
Table 2: Age                                                                                                                                CCuuPPPmmeee3uurrr3cccllaa.eee3ttnnnii0vvtttee
                                                                                                                                                                                            4. Data Analysis
Age                                            Frequency             Percentage                      Valid                                         353733...336000
AAggee                                         FFrreeqquueennccyy    PPeerrcc3ee3%%%nn.3ttaa0ggee  PPPeeeVV3rrr3aaccc.lleee3iidd0nnnttt            955777...606000                          4.1 Background of Employers
                                                                                                                                                  1990770..00.0000
30-40 years                                           11                   323343...323000           233343...323000                              110000..0000                              Table 1 addresses the gender of the
334100---445000 yyyeeeaaarrrsss                       11811                322449...422000           322494...224000                                                                        respondents. Most of the respondents
445111---556000 yyyeeeaaarrrsss                       1883                 33399.0..44000            33399..0.44000                         Cumulative                                      were Male (63.60%), with 36.40% Female.
565111---667000yyyeeeaaarrrsss                        11133                33..0000                   33..0000                              CCuuPPPmmeee2uurrr4cccll.aaeee2tt0nnniivvtttee
6611 --7700 yyeeaarrss                                 11                                                                                                                                   Table 2 shows the age of respondents.
                                                                                                                                                   223464...224000                          The majority of the respondents were
Table 3: Working Experience                                                                                                                        335646...445000                          51-60 years of age (39.40%), followed by
                                                                                                                                                  1550440..55.0000                          30-40 years (33.30%), then 41-50 years
5 to 10 years                                  Frequency             Percentage                      Valid                                        110000..0000                              old (24.20%) and 61-70 years old (3.00%).
5151ttooto111005yyeeyeaarrassrs                FFrreeqquueennccyy    PPeerrccee%nnttaaggee         PPPeeeVV2rrr4aaccc.lleee2iidd0nnnttt                                                     This shows that the majority of the
111115 tttooo 121055 yyyeeeaaarrrsss                                                                                                                                                        respondents on the age is valid as it was
11M55orttooe 22th00ayynee2aa0rrssyears                 8                  24%%.20                    212424...221000                                                                        plausible to be employers within the age
TMMoootrraeel tthhaann 2200 yyeeaarrss                 848                                           111228...211000                                                                        bracket of 51-60 years.
TToottaall                                             464                 212424...212000           141885...225000
                                                      1665                 111282...121000           1440550..55.0000                                                                       Table 3 shows the years of working
                                                      311355               114885...522000           110000..0000                                                                           experience in their firms. The maximum of
                                                      3333                1440550..55.0000                                                                                                  the respondents had experience of more
                                                                          110000..0000                                                                                                      than 20 years (45.50%), followed by 5 to
                                                                                                                                                                                            10 years (24.20%), then 15 to 20 years.
Table 4: Number of Projects Involved                                                                 Valid                               Cumulative                                         (18.20%). The least working experience is
                                                                     Percentage                    PPPeeeVV2rrr7aaccc.lleee3iidd0nnnttt  CCuuPPPmmeee2uurrr7cccll.aaeee3tt0nnniivvtttee     11 to 15 years (12.10%). This result shows
10 to 20 projects                              Frequency             PPeerrccee%nnttaaggee                                                                                                  that the employers have the necessary
112001 tttooo 232000 ppprrrooojjjeeeccctttsss  FFrreeqquueennccyy                                    222747...332000                           252771...335000                              experience the industry.
                                                                          27%%.30                    242484...225000                          1550110..5.50000
                                                       9             222774...323000                 1440880..5.50000                         110000..0000
                                                 989                                                 110000..0000
22M11orttooe 33th00appnrr3oo0jjeeccpttrssojects  1886                242484...522000
TMMoootrraeel tthhaann 3300 pprroojjeeccttss     113663              1440880..55.0000
TToottaall                                       3333 110000..0000

                                                                                                                                                                                            27
   22   23   24   25   26   27   28   29   30   31   32